Features Explained
Repeatability / Stability Indicator
Consisting of 6 vertical bars, when all the bars are fully illuminated and the last digit on the digital thickness value is stable, the gauge is reliably measuring the material thickness.
High Speed Scan with Minimum Thickness Display
By significantly increasing the measurement refresh rate this mode allows the user to make scanned passes over the test material. The smallest thickness value is held in memory and displayed when scanning is complete. This feature can also be used in conjunction with the minimum & maximum limit alarm feature (model dependant).
Differential Mode
Once a user defined nominal thickness value has been set, the gauge will display the +/- thickness difference from the nominal value entered.
Limit Alarm Mode
The user can define minimum and maximum thickness limits. If the measurement falls outside the upper or lower limit a red LED will light and the beeper sounds. A green LED will light to indicate an acceptable thickness.
V-Path Correction

Dual element transducers consist of a probe with two crystals (one to transmit and one to receive the sound pulse). The crystals are separated by an acoustic barrier - generating a 'V-shaped' sound path as the sound travels from one element to the other. This path is slightly longer than the direct path therefore V-path correction is used to calculate the correct thickness.
Measurement Modes Explained
Pulse Echo (PE):
The normal display mode, measures the total thickness from the base of the transducer probe to the material density boundary (typically the back wall). Ideal for pit and flaw detection.
Echo - Echo Mode (EE):
Also known as the ThruPaint™ Mode, EE ignores the coating thickness, displaying the material thickness from the top surface of the material to the material density boundary.
Display Modes Explained
Material Thickness Digits Display:
The standard display on all models, this displays the numerical thickness value in either millimetres (MM) or inches (IN).
Scan Bar Display:
A linear graphic display which allows users to graphically monitor changes in thickness readings. As the scale range can be adjusted by the user, this display is ideal for observing tiny variations in material thicknesses.
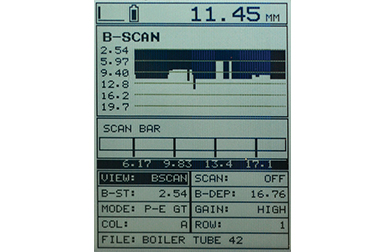
B-Scan Display:
A time based cross sectional 2D block view of the thickness provides a graphical view of the material thickness - ideal for relative depth analysis.
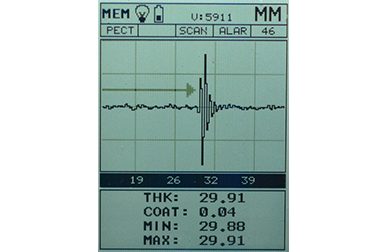
A-Scan Display; Full Wave (RF):*
The A-Scan display shows the sine wave created by the reflected sound, or oscillation, from the material being measured. In RF mode the full wave form is displayed.
A-Scan Display; Rectified (+ or -):*
Users can select to view either the positive or the negative cycle of the full waveform (RF). This rectified (RECT) display shows the amplitude of the echo versus the transit time.
* Available on MX2-DL Model only